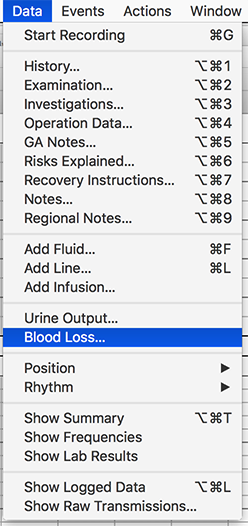
In this version of Monitor, blood loss and urine output have been changed from discreet events to events happening over a period of time. They are plotted as a bar graph below the Fluids graph. The bars are textured to distinguish them from drug infusions.

You can drag the bars to adjust their times. Drag from the ends to adjust start or finish time, or from the middle to move the entire bar. You can delete a bar by control clicking on it, and selecting delete.